Wednesday, December 28, 2005
EEG Graph
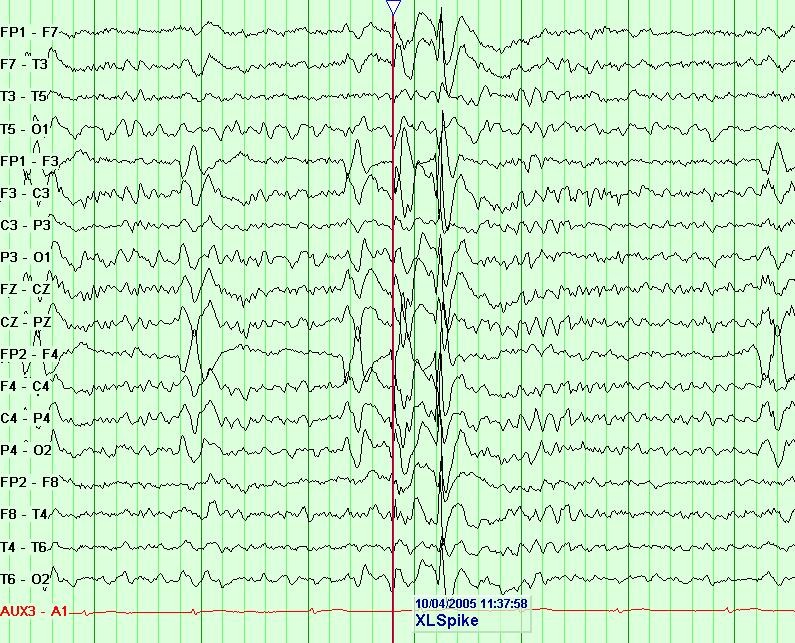
When you get an E.E.G., the resulting data is displayed as "squiggly" lines on paper, with each line representing an area of the head from which electrical activity is monitored. In cases where there is detectable seizure activity, it shows up as big abnormal "spikes." Obviously you need specific training in order to read and interpret the EEG, but a layman can get a bit of an inkling that something may be a bit off when viewing the readout. Below is a six second section of my most recent (non ambulatory) EEG. The red line marks the start of the abnormal "spikes" in electricity from the brain.
Subscribe to:
Post Comments (Atom)
No comments:
Post a Comment